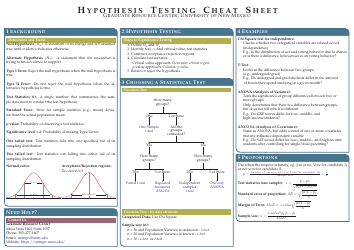
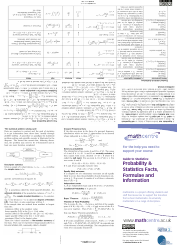
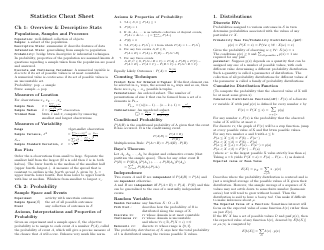
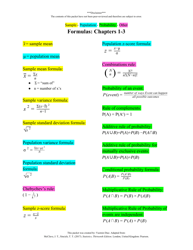
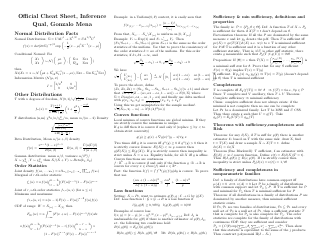
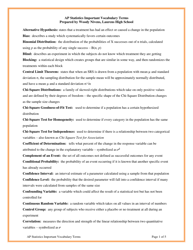
Statistics Hypothesis Testing Cheat Sheet - Harold Toomey

The document "Statistics Hypothesis Testing Cheat Sheet - Harold Toomey" is a cheat sheet that provides a concise overview of statistical hypothesis testing. It is likely intended as a quick reference guide or study aid for students or professionals who need to perform hypothesis tests in statistics.
FAQ
Q: What is hypothesis testing?
A: Hypothesis testing is a statistical method used to make inferences or conclusions about a population based on sample data.
Q: Why is hypothesis testing important?
A: Hypothesis testing helps us determine if a statement or claim about a population is likely to be true or not.
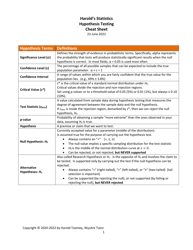
Q: What are the steps involved in hypothesis testing?
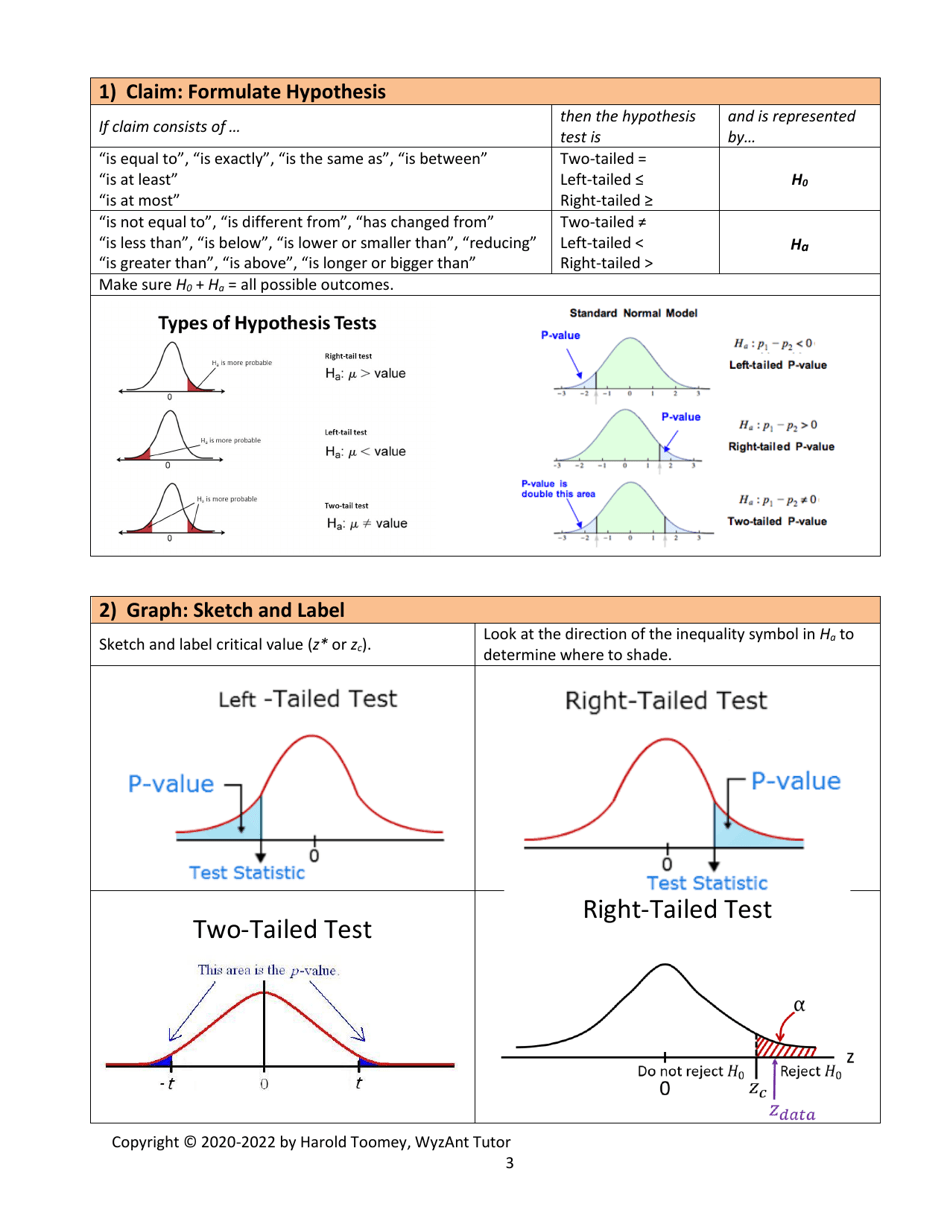
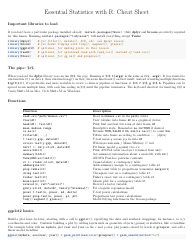
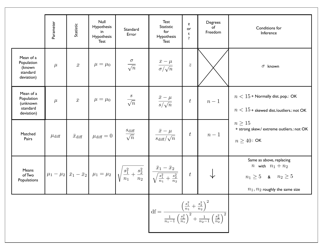
A: The steps involved in hypothesis testing are: 1) Formulate the null and alternative hypotheses, 2) Choose a significance level, 3) Collect and analyze the data, 4) Calculate the test statistic, 5) Make a decision based on the test statistic.
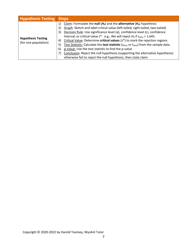
Q: What is the null hypothesis?
A: The null hypothesis is a statement that assumes there is no difference or relationship between variables in a population.
Q: What is the alternative hypothesis?
A: The alternative hypothesis is a statement that contradicts the null hypothesis and suggests there is a difference or relationship between variables in a population.
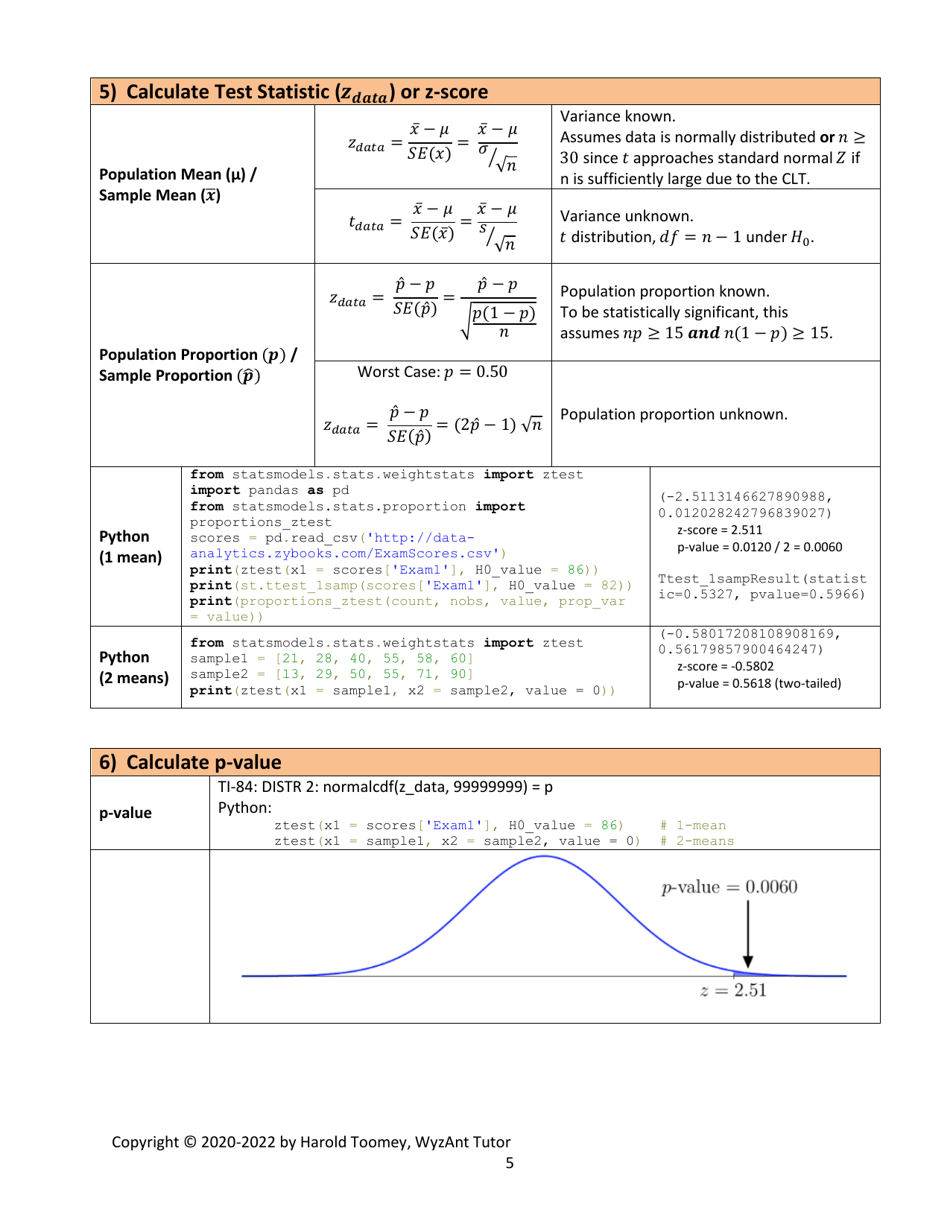
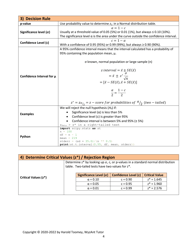
Q: What is a significance level?
A: The significance level, denoted as α (alpha), is the threshold value that determines when the null hypothesis is rejected.
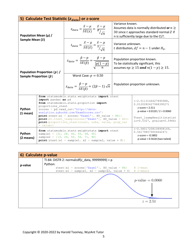
Q: What is a p-value?
A: The p-value is the probability of obtaining test results as extreme as the observed data, assuming the null hypothesis is true. A p-value less than the significance level indicates strong evidence against the null hypothesis.
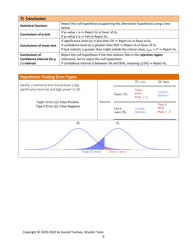
Q: What is a type I error?
A: A type I error occurs when the null hypothesis is rejected, but it is actually true. It represents a false positive result.
Q: What is a type II error?
A: A type II error occurs when the null hypothesis is not rejected, but it is actually false. It represents a false negative result.
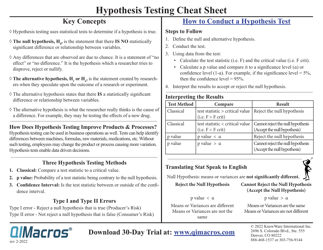
Q: What is a test statistic?
A: A test statistic is a numerical value calculated from sample data that is used to make a decision in hypothesis testing. The choice of test statistic depends on the type of hypothesis test being conducted.
Q: What are some common hypothesis tests?
A: Some common hypothesis tests include t-tests, z-tests, chi-square tests, and ANOVA tests.
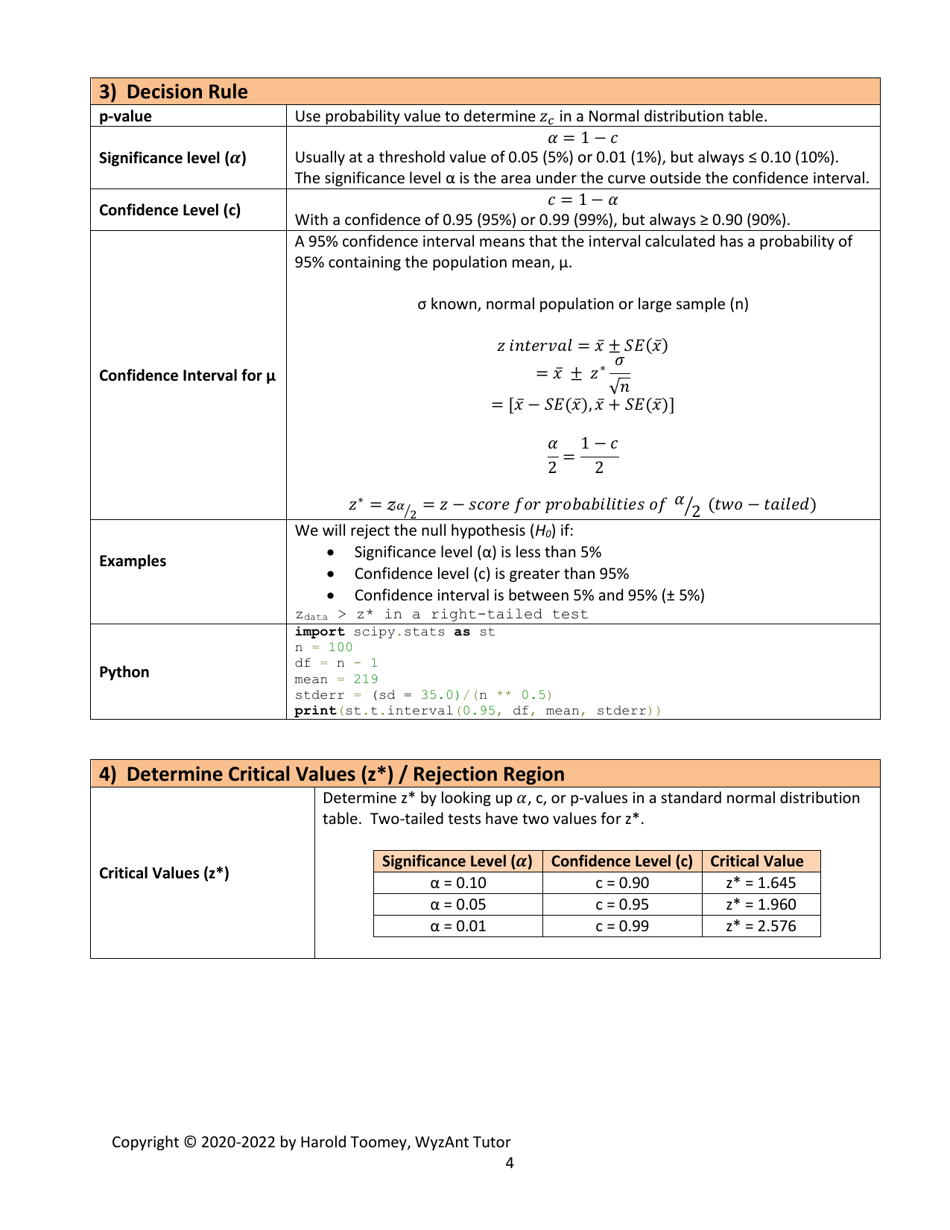
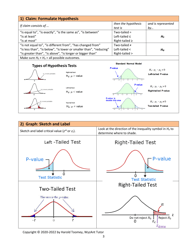
Q: What is the critical region?
A: The critical region is the range of test statistic values that lead to the rejection of the null hypothesis.
Q: When should the null hypothesis be rejected?
A: The null hypothesis should be rejected when the test statistic falls into the critical region, or when the p-value is less than the significance level.
Download Statistics Hypothesis Testing Cheat Sheet - Harold Toomey
1
2
3
4
5
6