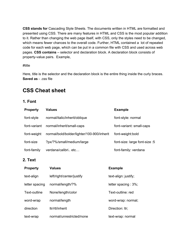
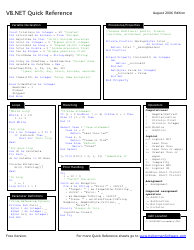
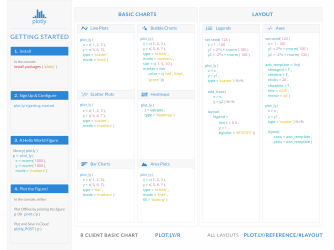
R Cheat Sheet - Plotly - Canada

R Cheat Sheet - Plotly - Canada is a reference guide that provides instructions and examples on how to use the Plotly library in R programming language specifically targeted for users in Canada. It helps users create interactive and visually appealing plots and charts for data analysis and visualization.
FAQ
Q: What is R?
A: R is a programming language and software environment for statistical computing and graphics.
Q: What is Plotly?
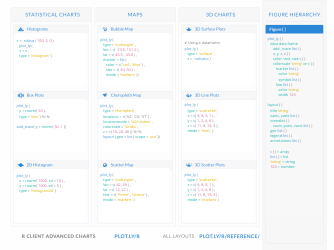
A: Plotly is a data visualization library in R that allows you to create interactive and visually appealing plots.
Q: What can I do with Plotly in R?
A: With Plotly in R, you can create various types of charts including scatter plots, bar charts, line plots, pie charts, and more.
Q: How do I install Plotly in R?
A: You can install Plotly in R by running the command: install.packages('plotly')
Q: How do I create a scatter plot in Plotly?
A: To create a scatter plot in Plotly, you can use the 'plot_ly()' function and pass in the data and desired aesthetic mappings.
Q: Can I create interactive plots with Plotly in R?
A: Yes, Plotly in R allows you to create interactive plots that enable users to hover over data points, zoom in/out, and more.
Q: Is Plotly available in Canada?
A: Yes, Plotly is available for use in Canada as it is a widely-used data visualization library in R.
Download R Cheat Sheet - Plotly - Canada
1
2