Free Graph Paper With Axis Templates
Graph Paper With Axis: What Is It?
A Graph Paper With Axis refers to a grid of vertical and horizontal lines with axes - reference lines that serve to measure coordinates.
Alternate Name:
- Graph Paper With X and Y Axis.
This abstract tool is often used by mathematicians, engineers, scientists, and data analysts to see how various indicators and figures relate to one another - whenever you want to enhance your presentation with the visual depiction of variables or
For a full list of Graph Paper With Axis templates please check out our library below.
You may use the ready-made template and customize it with statistics and figures you have at your disposal or make your own system of coordinates from scratch - draw two perpendicular lines and add the tip of an arrow at the end of every line to point the direction of growth or expansion.
This type of paper works perfectly for various diagrams and charts you may use to present and analyze data: Show how different metrics can be compared with the help of a bar chart prepared on graph paper that contains axes - for instance, the horizontal axis (X) will show the city the survey respondents come from while the vertical axis (Y) confirms how many residents of each city own a car (counting them in numbers or percentages). You may also implement this paper for a line graph to show how data changes over time. You can also learn how to measure the distance between coordinates using graph paper - this may be implemented in class or in the workplace when you need to introduce a project where the position of a certain point or object is crucial for every part of the construction to function properly.
Still looking for a particular template? Take a look at the related templates below:
Documents:
36
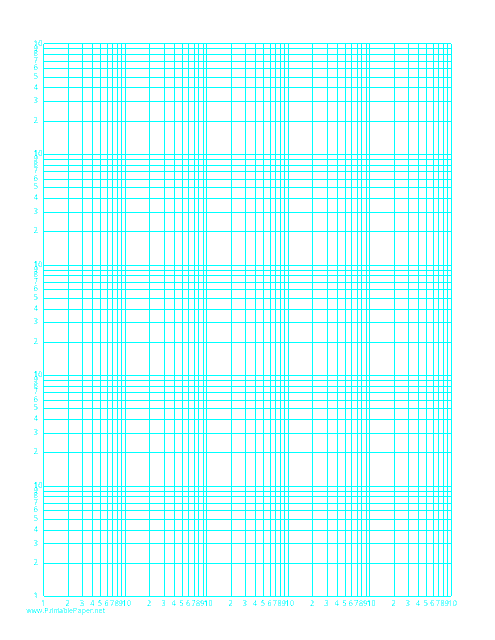
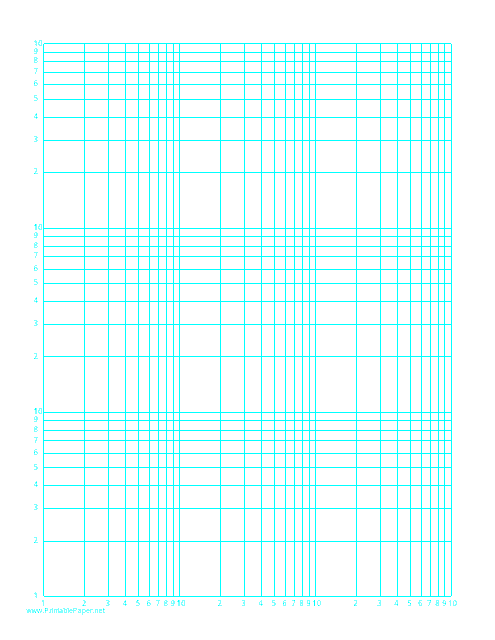
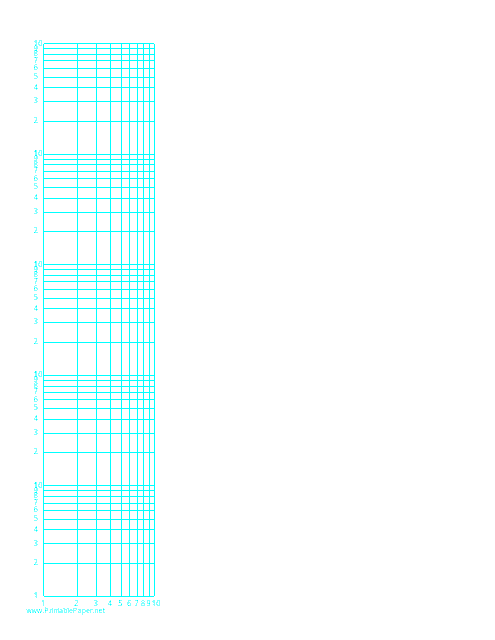
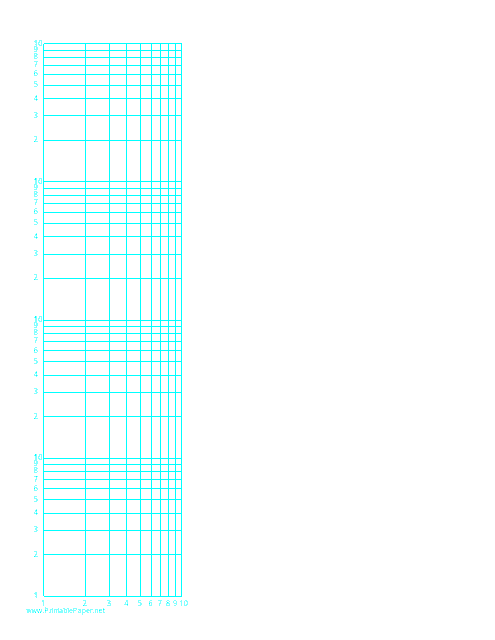
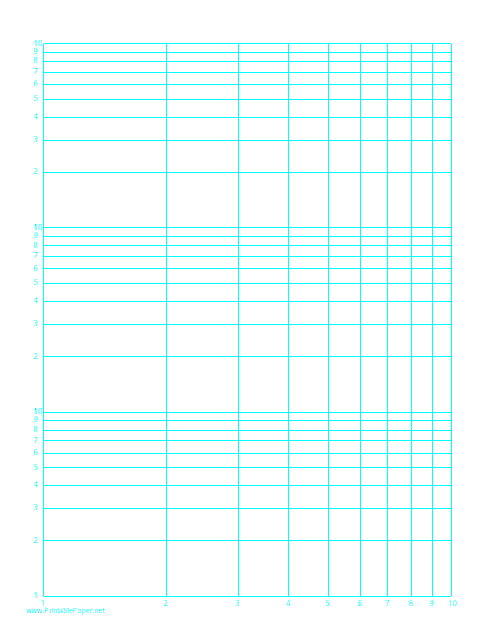
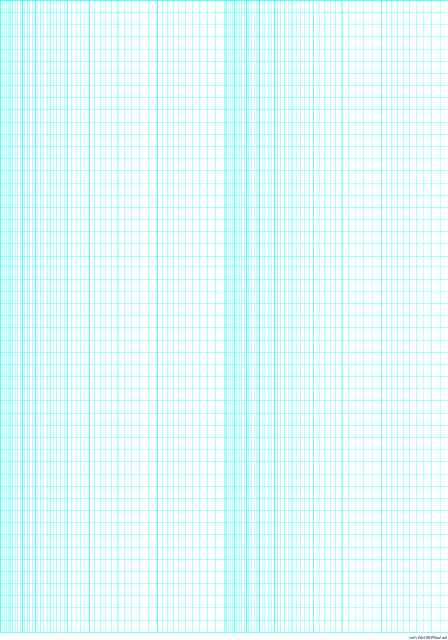
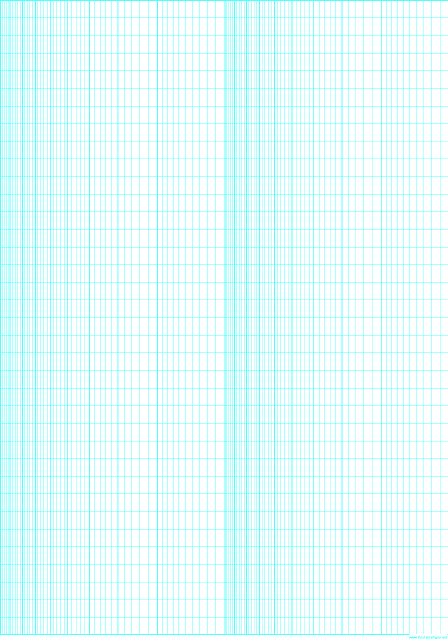
This document provides a printable version of logarithmic graph paper with both horizontal and vertical axes spanning five decades. Ideal for mathematical and scientific calculations where the scale of data spans several orders of magnitude. It is designed to fit on a standard letter-sized paper.
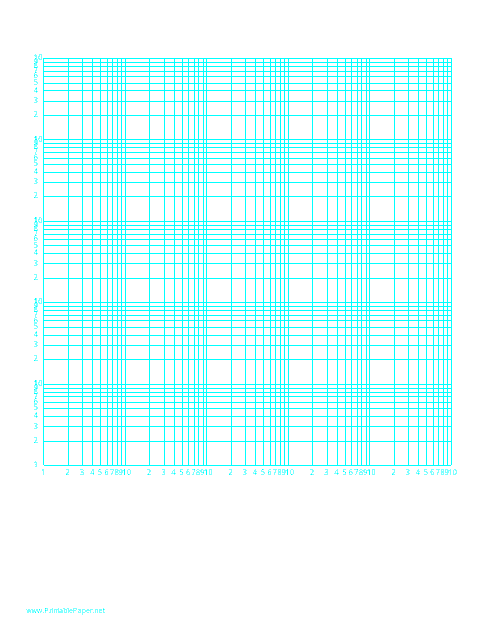
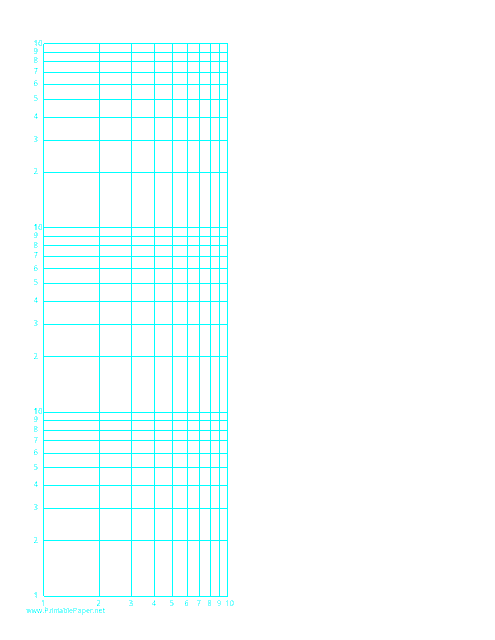
This document provides a printable template for a log-log graph paper. It features logarithmic scales on both horizontal and vertical axes, spanning five decades each, fitting on a standard letter-sized paper. Ideal for advanced mathematical and scientific plotting.
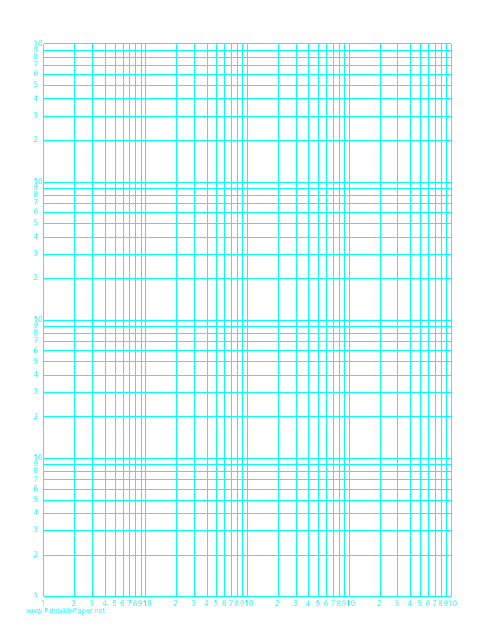
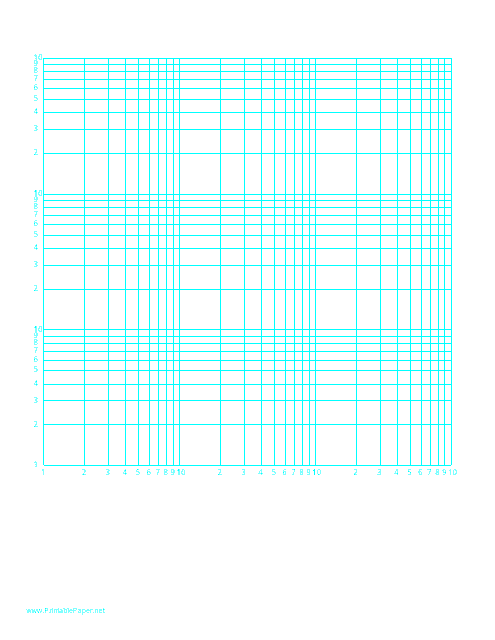
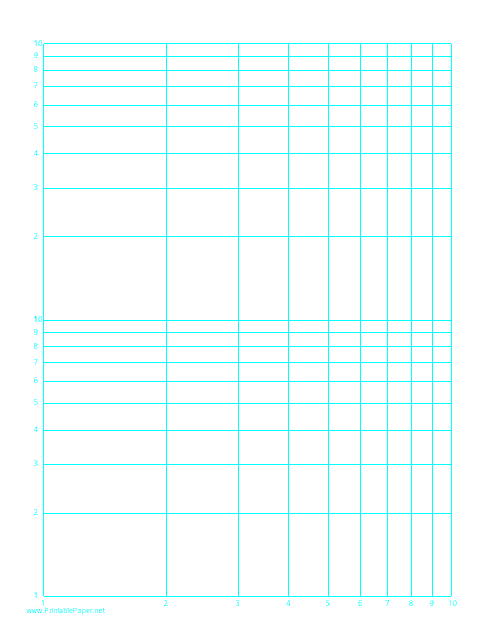
This document provides a grid paper template for a logarithmic scale plot. It features both horizontal and vertical axes, each divided into four decades, on a standard letter-sized paper. It is often used in fields such as engineering or mathematics for presenting data with wide ranges.
This type of document serves as a graphing tool with both horizontal and vertical axes in logarithmic scale. It is typically used in various scientific and engineering fields for representing data that cover a large range.
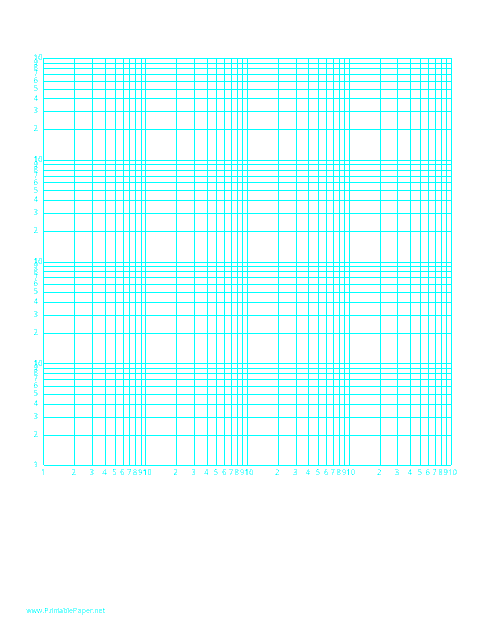
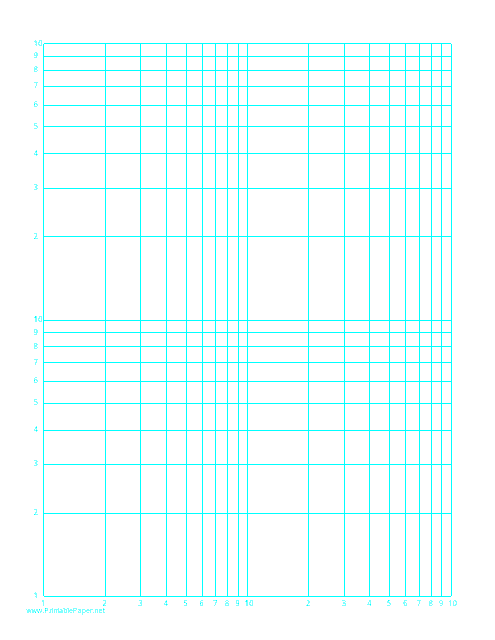
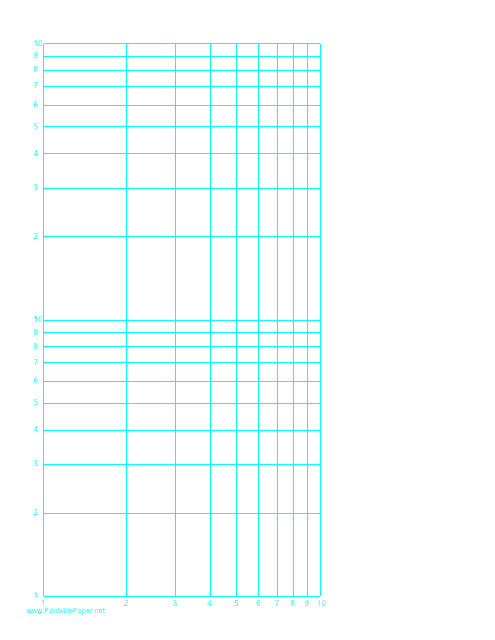
This document is a printable template for log-log graph paper designed on a letter-sized layout. It features both a logarithmic horizontal and vertical axis, each spanning three decades, and is useful for a variety of scientific and engineering calculations.
This document provides a grid for plotting exponential data as per logarithmic scale. It's designed with logarithmic horizontal and vertical axes each spanning three decades. It's beneficial for visualising multiplicative changes or variations.
This type of document provides a printable format of a log-log graphing paper featuring a logarithmic horizontal axis (two decades) and logarithmic vertical axis (two decades). Ideal for plotting data with wide ranges of values in a compact way.
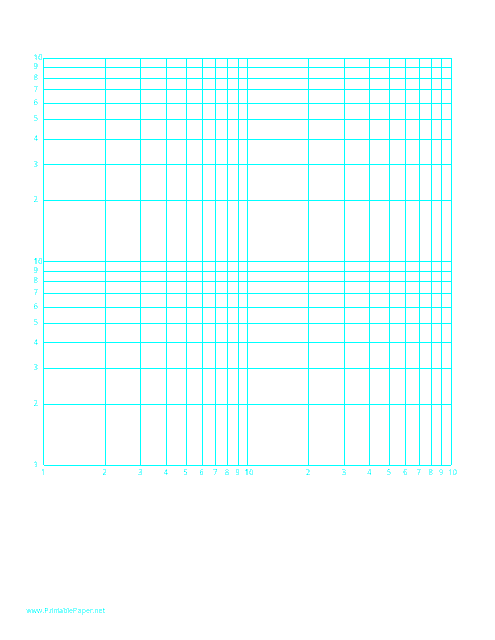
This type of document is a specific type of graphing paper that enables data presentation on a scale that displays multiple orders of magnitude. It is utilized in various fields, including engineering and mathematics. The horizontal and vertical axis each represents two decades in a logarithmic scale.
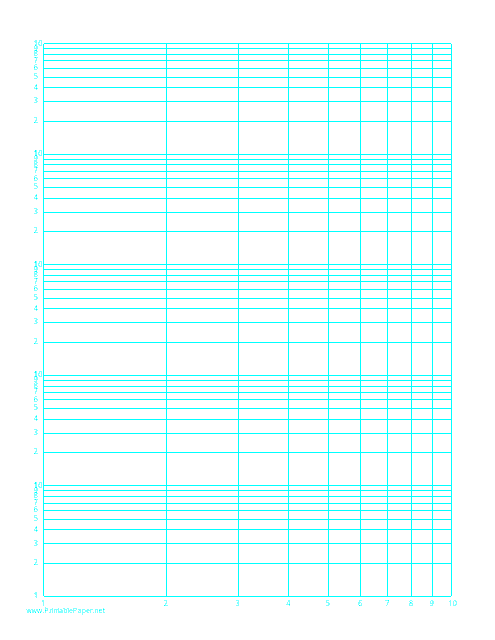
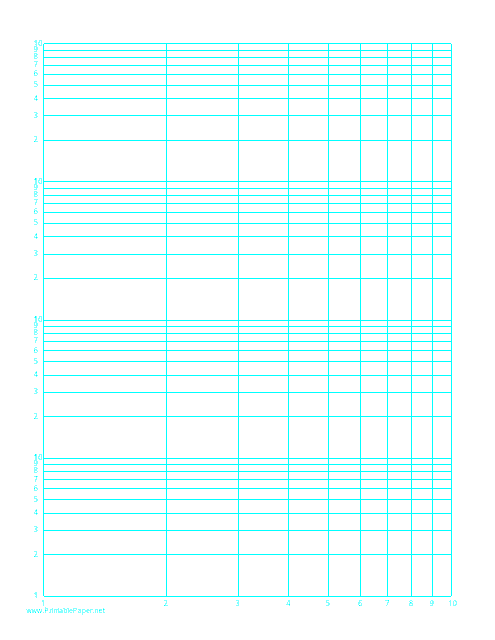
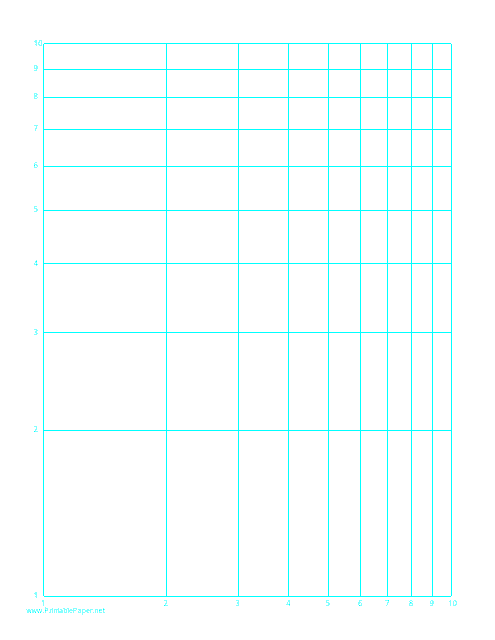
This type of document is designed for mathematical and scientific calculations. It comes with a logarithmic scale on both the horizontal axis (one decade) and vertical axis (five decades) on a standard letter-sized paper. Ideal for representing wide-ranging quantities.
This type of document is utilized for drawing graphs with a wide-ranging scale. It's a special type of paper which allows plotting of functions on both horizontal and vertical axes, displaying one decade on the horizontal axis and five decades on the vertical axis. Suitable for scientific and engineering presentations.
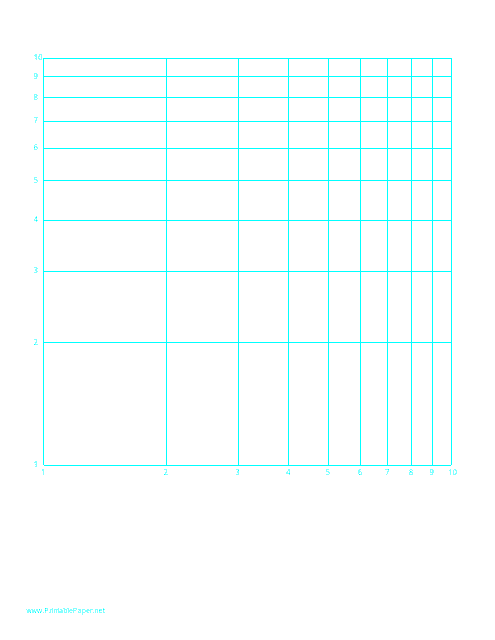
This template is typically used for creating and printing log-log graph paper with specified scaling of logarithmic horizontal axis (one decade) and logarithmic vertical axis (four decades) on the standard letter-size paper. The customizable feature of the template can be used in various applications such as in scientific research, engineering, and mathematical calculations.
This type of document is a printable template for graphing purposes. It features a logarithmic scale on both horizontal and vertical axes, the former covering one decade and the latter encompassing four decades, to plot exponential and rapid-growth data. It's often used in scientific and engineering disciplines.
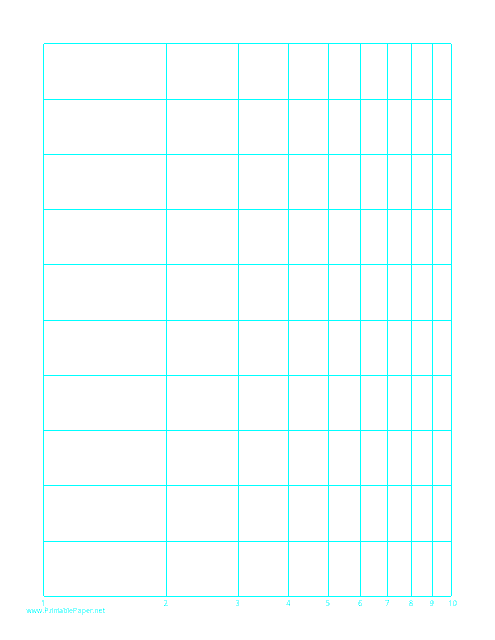
This document is used for plotting data on a logarithmic scale. It is essential for fields like engineering and physics where one needs to illustrate data that changes exponentially or follows a power law. It comprises a horizontal axis spanning one decade and a vertical axis spanning three decades.
This document is a customizable template for log-log graph paper. It features a logarithmic scale on both the horizontal axis that spans one decade and the vertical axis spanning three decades. Ideal for plotting data with wide-ranging values in scientific and engineering disciplines.
This document is a cyan log-log paper template with a logarithmic horizontal axis spanning one decade and a logarithmic vertical axis spanning two decades. It is used for plotting data with logarithmic scales.
This template is designed for creating graph paper with logarithmic scales on both the horizontal and vertical axes. It is suitable for plotting functions with exponential growth or decay, auditory and seismic data, or any other measurements that cover a large range of values on a letter-sized paper.
This template is designed for plotting complex data on a logarithmic scale for both horizontal and vertical axes. Providing predefined scales, it's perfect for technical and scientific uses, especially when dealing with extensive data ranges or exponential growth or decline.
This template is used for plotting data on a logarithmic scale for both the horizontal and vertical axis. The scales are equal and cover one decade, allowing for more precise visualization and comparison of exponential or rapidly-changing data.
This document provides a template for graph paper with a logarithmic horizontal scale covering one decade and a linear vertical scale. Suitable for mathematical, scientific, and engineering calculations, it is formatted to fit on letter-sized paper.
This type of document is a graphical representation tool that combines a logarithmic scale with a regular linear scale, typically used in the field of scientific and engineering studies to represent exponential data.
This document provides a printable semi-logarithmic graph paper template with 31 divisions along the long axis and 2-cycle divisions. Ideal for plotting data with large ranges of values in a linearly increasing or decreasing manner.
This document provides an illustration of 25 inch scale graph paper that is usually utilized in plotting two-dimensional graphs, performing mathematical functions, or creating designs. It features a set of perpendicular lines (axis) forming a grid.
This document is a tool utilized mostly in mathematics and engineering, providing a printable grid sheet with marked axes. It is typically used for plotting graphs, solving equations, or drawing designs that need precise measurements.
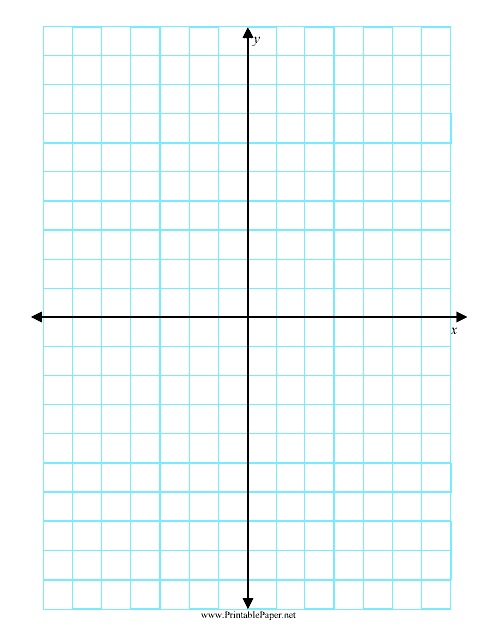
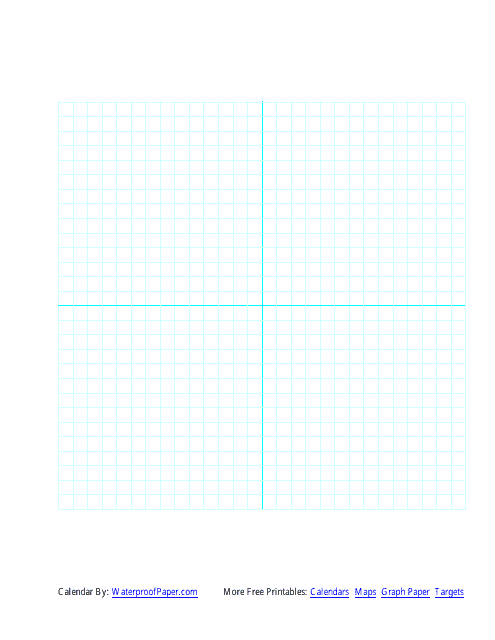
This document provides a cyan 5-inch axis graph paper template, which is used for plotting graphs and organizing data points.
This document is a printable template for 1cm graph paper designed with X and Y axis, commonly used for creating graphs, plotting equations or drawing designs in mathematics or science.
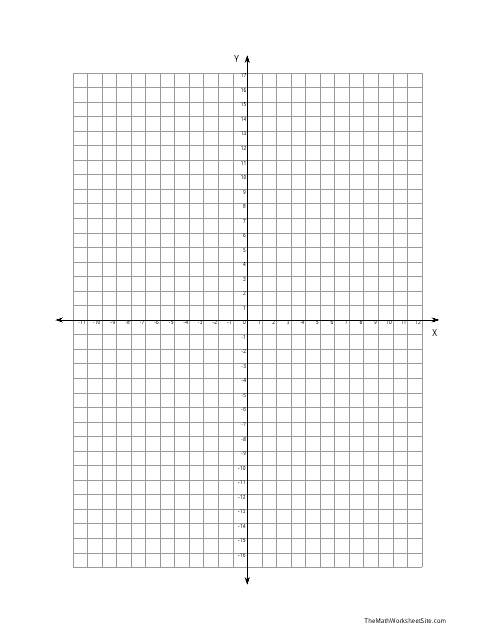
This type of document provides a ready-to-use blueprint for drawing diagrams or plotting coordinates on a graph, with clearly marked X and Y axes. It is often used in education, engineering, and various scientific fields.
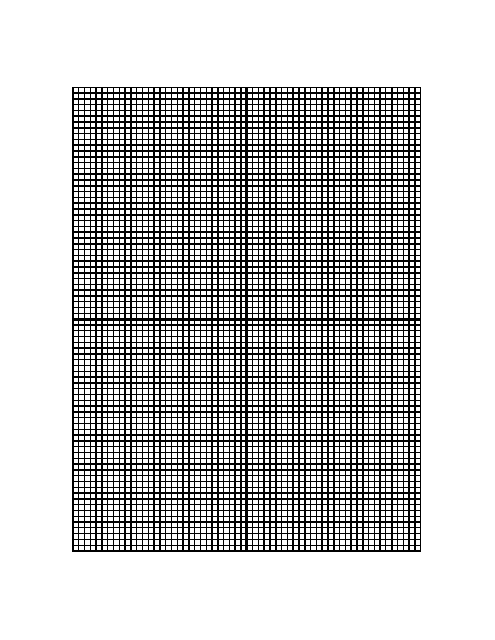
This type of document provides black graph paper templates with an axis. It is available through the Academic Support Center at Daytona State College in Florida.
This type of document is used for mathematical or graphical exercises and activities. It contains a grid with X and Y axes, divided into coordinated spaces, on an entirely blank page, allowing for in-depth plotting or charting in mathematical assignments or projects.
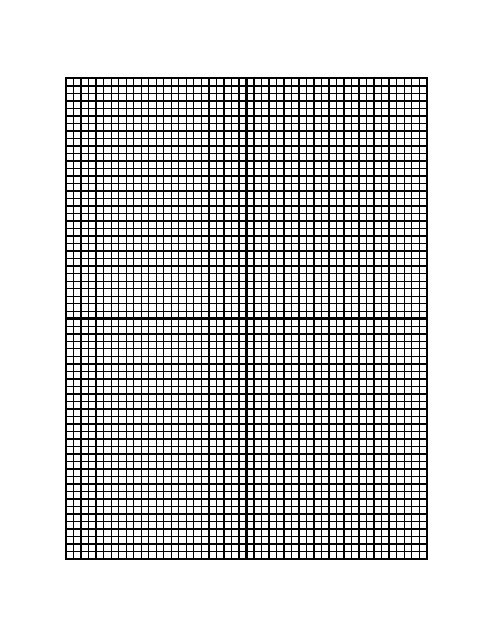
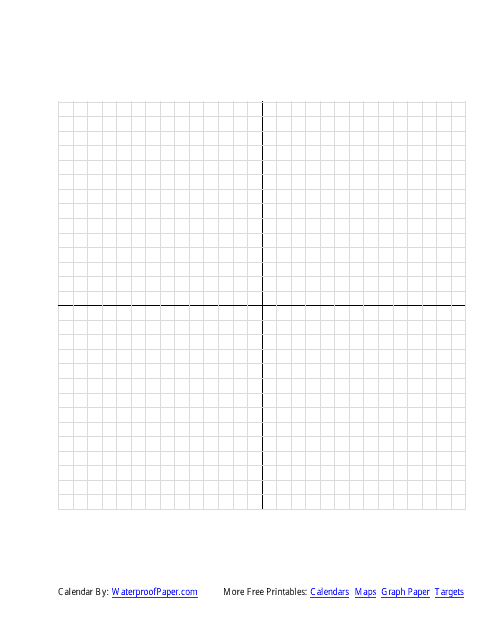
This document is a printable graph paper with a centered x-y axis. It contains 8 lines per inch, conducive for precise plotting of statistical and mathematical data. Ideal for students, engineers, and other professionals who require accurate graphs.
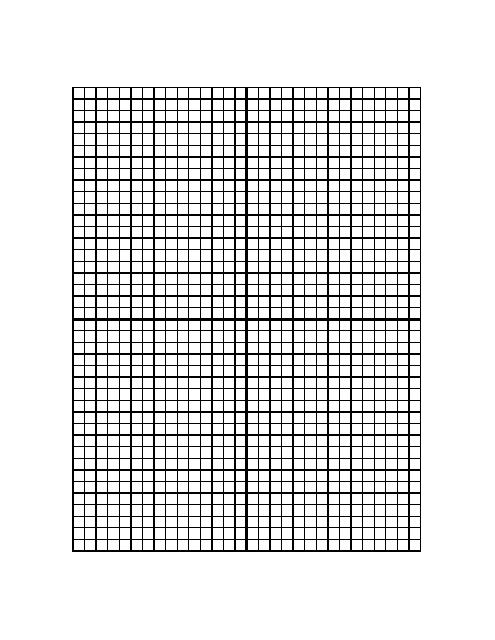
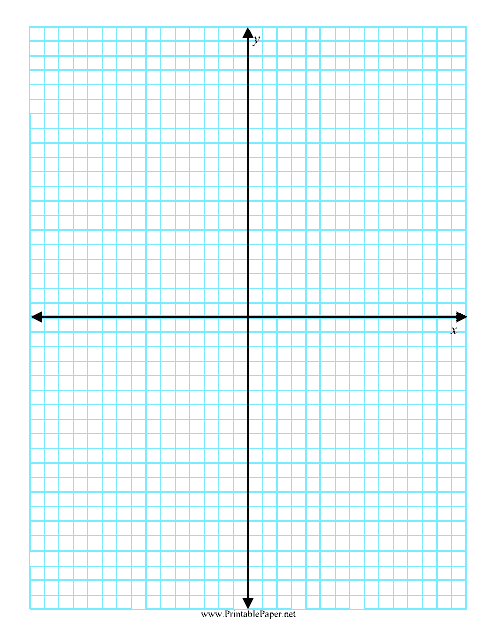
This document provides a printable graph paper layout with a centered XY axis. It features a line density of 5 lines per inch, useful for creating detailed graphs in mathematics, engineering, or science.
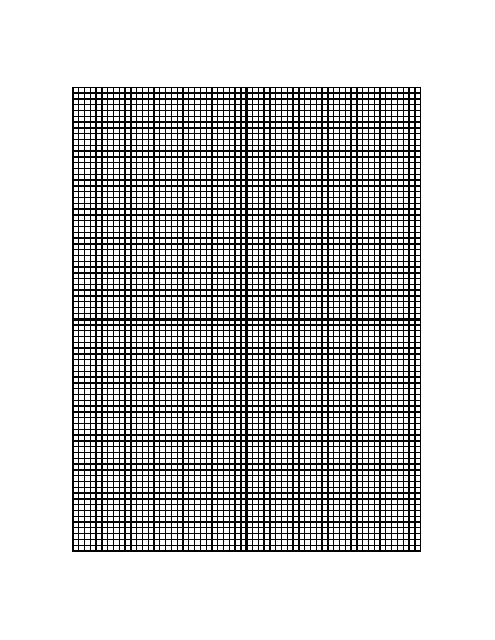
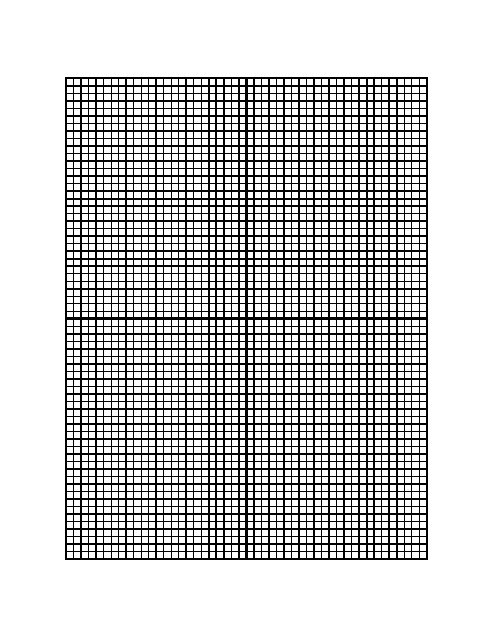
This document provides a template of graph paper with a density of 10 lines per inch, featuring a centered X-Y axis. Ideal for mathematical plotting and graphing, architecture and drafting projects.
This document provides a printable grid paper with horizontal and vertical lines (axes), primarily used for graphing purposes in mathematics, engineering, and architectural designs. It aids in representing numerical data or drawing models with precision.